Many retailers use a “top performing SKUs” report to some extent. The purpose of these reports is to help store managers figure out if they have an operational or supply chain issue for specific SKUs by comparing how these items perform in their stores compared to other stores. This approach might be as straightforward as comparing stores within the same region, or as advanced as clustering together stores in similar demographics, climates, or with other external and internal conditions in common.
To this end, an executive will typically send a report with a list of 50 to 200 top-performing SKUs to selling floor teams. Store managers can then take a closer look to compare and contrast how those SKUs perform in their stores. Executives ask store managers to ask themselves, “Why is product X not selling at my store the same way it is in the rest of the territory?” Store managers are charged with investigating what went wrong in their stores, and then, in a best-case scenario, fixing the perceived cause in hopes that the correction will get sales back on track.
But what if the comparison isn’t actually valid?
If you’re trying the “top performers” approach, you probably notice it’s minimally effective at best. Typically, these initiatives are met with lukewarm enthusiasm from store teams and suffer from low compliance as a result. Your first instinct may be to find fault in the store’s capacity to execute. You might even question the likelihood that store teams will be inspired by any data-driven projects. But a deeper examination will reveal that these top performers reports suffer from high false positives (i.e. suggesting there’s an issue when there isn’t one), which then leads to less engagement from stores over time as sales associates get frustrated chasing ghosts.
Yes, a top performers report can catch a good operational failure once in a while, but in most cases it doesn’t. The report fails because the SKU-level comparison you’re making is, in most cases, simply invalid. Ask any store manager and she will tell you that her store is different. The clients visiting the store are different, the conditions around the store are different, and even the competitors they’re facing are different. Therefore, the top performers are also different.
But that’s only the tip of the iceberg. In addition to inspiring apathy from stores, the top performers approach tends to overlook lost sales opportunities by focusing on a very small subset of SKUs. The SKUs that are selling at high levels within a region or cluster aren’t necessarily relevant. Each store has its own unique client base and environmental factors—and your POS data, analyzed more comprehensively, can unlock a range of patterns that reveal unmet demand. What about all those potential local top performers that should be selling at high levels only at specific locations, but are failing to meet their full sales potential because of a chronic operational issue? It’s critical to ensure these local bestsellers are available and visible to enhance the customer experience and drive brand loyalty.
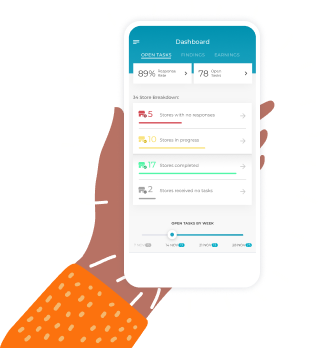
On average, a store that is serviced by CB4’s solution receives about 10-20 recommendations a month, and these recommendations target thousands of different SKUs over a period of several months across the entire chain.
But that’s only half of the picture. What about more advanced ways to cluster stores? What if we build clusters and group our stores according to demographics, climate, and other variables? Maybe even cluster stores according to product categories?
Indeed, this approach will reduce the incidence of false positives, but only negligibly. Why? Because there are so many micro conditions affecting stores’ demand for a SKU that it’s nearly impossible to create valid like-to-like comparison groups of stores. For example, think of two stores that have similar demographics and climate. If one store is located next to a SoulCycle, putting a chain’s top-selling sugary sodas in the window might do more harm than good. Traditional reporting is unable to account for variables like this one.
In summary, the demand for individual products in stores varies because the customers shopping in the stores vary, and the conditions surrounding the stores differ. You might get away with such a comparison when looking at stores or categories. But on a SKU level, all the different conditions surrounding the stores make a like-to-like comparison close to impossible. When you rely only on top performance, you risk frustrating store managers and losing sales opportunities.
What do you think? Have you tried using reporting to alert store managers attention to possible opportunities? Was it successful? Please share! Would love to hear your thoughts.
Interested in learning more about CB4’s software? Take a look at our Product Overview resources to learn how IT teams create actionable and relevant recommendations from simple POS data.


