Last month, as COVID-19 began to hit New York City hard, I flew back to Colorado in order to weather the storm with my parents and sister. I soon found myself trying to explain what I do for work. Unsatisfied with “we use AI to identify in-store opportunities”, we moved onto what exactly a “Variable Order Bayesian Network (VOBN)” is and why it’s so powerful in retail.
The simple explanation is that a VOBN is a machine learning model with the power to identify how various inputs/outputs interact with each other. The beauty of this approach is that it allows users to understand how many different inputs and factors interact without looking at each factor independently (including the myriad of data we are unable to capture).
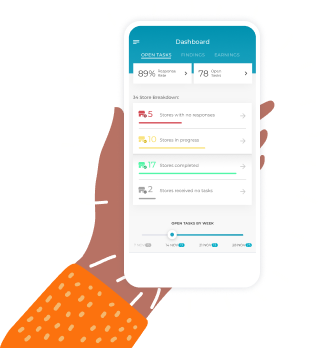
When we run CB4’s algorithms against a retailer’s POS data, we pinpoint demand for specific products in individual stores and then alert store teams when a product in the store is failing to sell to its high demand.
Last week, I found myself unable to stop thinking about a question my father and I had discussed while nerding out at dinner: What else can we use CB4’s AI algorithms to predict? Is it possible to apply CB4’s anomaly detection to the COVID-19 crisis and predict the next hotspots? I realized this was worth some further investigation.
As the Sales Engineer at CB4, I have experience modeling foreign datasets. I’ve partnered with some of the largest retailers in the world to help analyze their data and derive relevant insights. Armed with this experience, my mission was clear: determine if county-level demographics are sufficient to understand and predict COVID-19 outbreaks.
My strategy for predicting disease progress was fairly simple. I would gather as much data as I could, and manipulate it to the proper formatting and structure so that I could upload it to CB4’s AI backend.
I started by creating a parallel to our typical retail analysis. In place of the individual brick-and-mortar retail stores, I plugged in the roughly 3,000 counties in the US. In place of the products they sell, I plugged in each county’s demographics.
A quick visit to the data scientist candy store (the US Census website), and I was now armed with a seemingly limitless supply of demographic data to describe the communities living in each county.

I simplified the approach to look at just 4 main categories of Census Data:
- Sex and Age
- Income and Employment
- Commuting and Transportation
- Household Data (describing the composition and size of households)
Each category contained hundreds of data points. I narrowed my scope down to the 20 or 30 most relevant pieces of information for each category and began to clean and format my data.
After some investigation, I decided to divide counties into three segments based on their total populations as reported in 2018. In equal thirds, I created segments for Small (1101 counties), Medium (1049 counties) and Large (1045 counties). Even among these segments, county size by the total population has a large influence on the remaining raw values I had gathered. To minimize the impact of this bias, I converted the magnitude data (i.e. numbers of people) and normalized it to a percentage of the county’s population.
After a few rounds of experimentation, I was onto something. I finally had results to validate. But it was immediately apparent that many of the patterns the system generated were not relevant (e.g. there are fewer females in County XYZ than expected). So I applied a few filters to isolate relevant Covid patterns.
Effectively, I was looking for counties with what in CB4 terms we’d call “unmet demand for coronavirus.” Usually, when we say this, we’re referring to a product with high predicted demand at a location but low sales. In this case, I was looking for counties with low rates of infection that have similar characteristics to counties with a lot of cases of the virus.
Armed with 37 such instances, I dug deeper into a single pattern:

The pattern can be read: “In Counties WHERE:”
- The average family size of single-mother households is greater than 3.22 people
- Less than 17% of the population is over the age of 65
- Of the population over 65yrs, there are fewer than 80 Males for every 100 Females
“THEN the rate of confirmed cases of COVID-19 are high”.
In counties with these characteristics, we see a significantly higher chance of a COVID outbreak. There are eight counties in the fuzzy cluster of 64 where the pattern holds true, but there has not been a high number of reported infections. In other words, these are counties that could see a spike soon.
It is this type of insight from CB4 that excites me as a data analyst. Conventional analyses may be able to tell me that as an individual, men are more likely to have serious complications associated with the virus than women. Infection statistics and mainstream reports may be able to identify that elderly citizens (over the age of 65) are at greater risk. But CB4’s unique output is able to help isolate the ways in which community demographics might interact and overlap to model high-risk communities.
By isolating counties where the coronavirus has unexpectedly low prevalence, we can prepare people for a potential surge. For example, if local governments can anticipate with counties are“at-risk,” they can activate to help residents get swift access to resources. We can also study these example counties to see if any regulations or community guidelines are responsible for the successful suppression of the outbreak. As testing becomes more prevalent, we can track these counties further. Perhaps infection rates are higher, but fewer patients have symptoms that currently warrant testing. By working within a smaller population, we may be able to more quickly understand how the disease presents itself in order to fight it.
Through this exploration, I found that CB4’s unique approach to investigating store demand is well-primed to pivot and be applied to other aggregate criteria. Anecdotally, we were able to confirm some of the predictions through quick google searches of each county. More scientifically, the sheer volume of successful recommendations that CB4 has sent to clients helps to confirm our confidence in this approach.
Just like in retail, we were able to use CB4’s advanced pattern detection technology to flip the typical analysis on its head and ascertain new insight into the COVID-19 outbreak. I’m excited to continue learning and exploring the possibilities available. As a data guy, I am interested in continuing to add new census data, analyze coronavirus-related deaths and recovery figures, and expand this analysis.
What information would you like to see me explore? If you have any questions about the analysis or would like to suggest further topics, please get in touch with me at danielh@cb4.com.